May 18, 2023 report
This article has been reviewed according to Science X's editorial process and policies. Editors have highlighted the following attributes while ensuring the content's credibility:
fact-checked
peer-reviewed publication
trusted source
proofread
A proposed new metric to quantify genetic dissimilarities between an individual and a training population

A team of bioinformatics researchers affiliated with multiple institutions in the U.S. and Aarhus University in Denmark is proposing a new metric to quantify genetic dissimilarities between an individual and a training population. Their study is reported in the journal Nature. The editors at Nature have also published a Research Briefing in the same journal issue outlining the work done by the team on this effort.
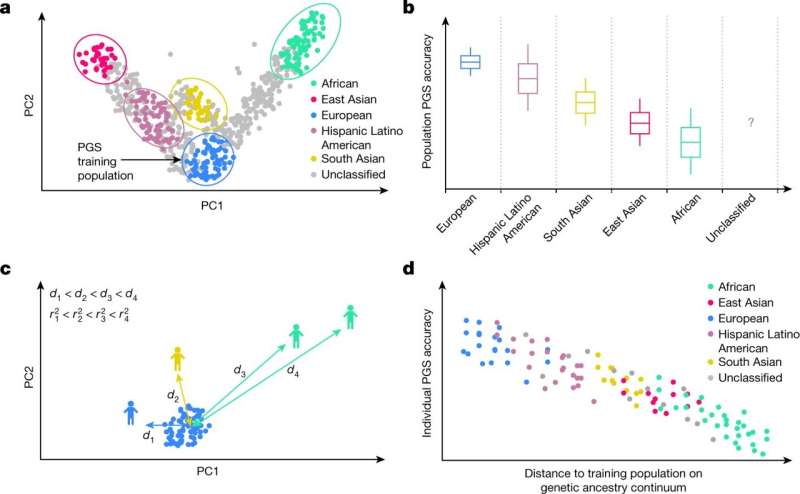
Polygenic scores (PGSs) are tools to estimate the probability that a certain trait or disease is based on a genetic background. PGSs are generally calculated by adding up the effects of many common genetic variants associated with traits of interest. But the accuracy of derived scores is dependent on the degree to which the genetic variants used to construct them actually capture the genetic diversity of the population from which they are taken.
This usually means that if a given population used to train the PGSs is genetically different from the population to which the test is applied, the PGSs may not perform well. To make such scores more useful, the researchers are proposing a new metric called genetic distance (GD)—its purpose is to quantify genetic dissimilarities between individuals and training populations based on genome-wide allele frequencies.
The new metric would range from 0 (representing identical traits) to 1 (representing traits that are completely different)—and it would also take into account both ancient and recent evolutionary events that have impacted a given human population. To support the use of the new metric, the research team showed that GD can be inversely correlated with PGS for some diseases and traits across populations, even those usually considered to be homogeneous. The team also demonstrated that GD could be used to identify people who could possibly benefit from PGSs that have been trained on specific populations, or conversely, those that are more diverse—or PGSs that rely on different sets of variants.
The team concludes that their metric could provide a continuous measure for gauging the accuracy of PGSs and notes that it also highlights the importance of taking into account genetic diversity when developing PGSs.
More information: Yi Ding et al, Polygenic scoring accuracy varies across the genetic ancestry continuum, Nature (2023). DOI: 10.1038/s41586-023-06079-4
A continuous measure for understanding the accuracy of genetically based predictions, Nature (2023). DOI: 10.1038/d41586-023-01492-1
© 2023 Science X Network


