
OPQ’s 2022 Report Shows the Global Task of Ensuring Quality
July 18, 2023The Office of Pharmaceutical Quality (OPQ), located within FDA’s Center for Drug Evaluation and Research (CDER), uses global inspection, surveillance, policy, and research activities to set quality standards for drugs. Among its top priorities, OPQ’s Director Mike Kopcha has recently said that OPQ is focused on quality problems that contribute to drug shortages.
Consistent with that initiative, OPQ recently issued its 2022 Annual Report on the State of Pharmaceutical Quality. The report reiterated a commitment to maintain the supply chain and provides more context about how OPQ—and FDA, more generally—are approaching quality and enforcement as we continue to hurtle past the COVID-19 public health emergency (PHE).
Here’s a breakdown of some of the more interesting highlights, statistics and graphics from the FY 2022 report.
Geography of Manufacturing Sites
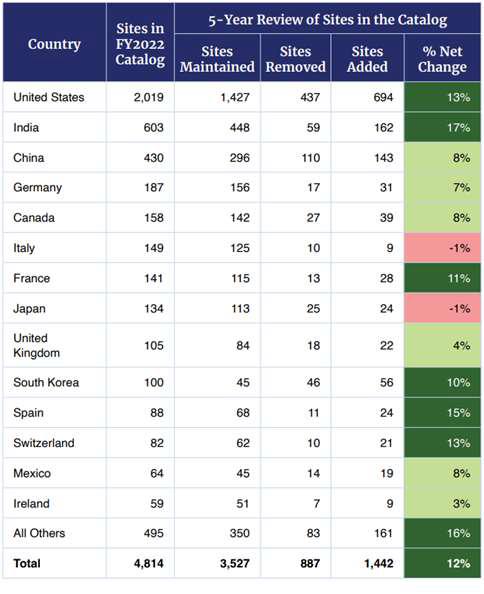
OPQ reports that as of October 2022, CDER’s manufacturing site catalog listed 4,814 facilities, a 12% increase over 2018. Forty percent of those sites are in what CDER terms the “No Application” sector, meaning that those sites make over the counter (OTC) products, unapproved drugs, and homeopathic products, all sold without premarket approvals. That leaves 60% that manufacture at least one application product. Those include biological products licensed under Biologics License Applications (BLAs), approved drugs under New Drug Applications (NDAs), and generic products under approved Abbreviated New Drug Applications (ANDAs).
As one might expect, the lion’s share of the registered facilities—over 2,000 of the total—are located here in the U.S. But the Report helps emphasize the global challenges FDA faces trying to ensure quality. After the U.S., the most prominent site for facilities was India, with over 600 sites. China was third with over 430 sites, and after that, several countries in Europe and in Asia each had over a hundred catalog sites, including Germany, Canada, Italy, France, Japan, the U.K., and South Korea.
Table: Inventory Shift Over FY2018-FY2022 for Countries (Greater Than 50 Sites)
Drug Products
In addition to a catalog of manufacturing sites, OPQ reports that CDER also keeps a drug product catalog that contains over 140,000 entries. Of those, a whopping 123,000 are non-application products that have a unique national drug code number, leaving around 17,000 products covered under BLAs, NDAs, and ANDAs. For these covered products, voluntary reports to MedWatch increased by seven percent for 2022, but other monitoring such as Field Alert Reports, Consumer Complaints, and Biological Product Deviation Reports showed declines in reporting. OPQ attributes that in part to the decrease in the use of injectable products as the PHE waned. The PHE also had a dramatic effect on import alerts. FDA issued 28 quality-related import alerts in 2022, and most of those 28 alerts were for hand sanitizers that contained impurities or had other defects.
Recalls
Recalls hit a five-year peak in 2022. OPQ reported that 166 catalog sites generated 912 recalls. Four specific kinds of events comprised over a third of the 900+ recalls. Temperature problems were the primary leaders, as the leading event was temperature abuse at 130 recalls, followed by 100 recalls related to products held outside appropriate storage temperature conditions. CGMP deviations caused 56 recalls, and excipient manufacturers performed 51 recalls due to contamination.
Warning Letters
Non-sterile, non-application products received most warning letters issued in 2022, according to OPQ. FDA issued 72 CGMP-related warning letters to pharmaceutical manufacturing sites, and over two-thirds of those went to makers of non-application products. That number is notable because those sites comprised only 30% of inspections. Again, the effects of the PHE lingered in this area, as FDA targeted hand sanitizer manufacturers with 31 of those 72 letters. The top-five CGMP issues in 2022 were related to 1) quality control units, 2) production record review/investigations, 3) written procedures/deviations, 4) equipment cleaning and maintenance, and 5) testing and release procedures.
Sampling
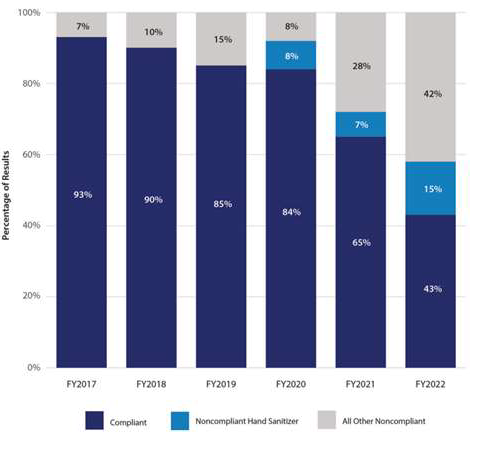
While the 2022 Report does not specify what specific circumstances might prompt FDA to take samples for testing, of those that FDA collected, 892 of 1,552 samples—57%–tested at FDA laboratories were out of specification or non-compliant. FDA’s PHE-focused testing found more troubles with sanitizers, as all the non-compliant COVID tests came from hand sanitizer products that were either subpotent or contaminated with impurities. 2022 marked the fifth straight year that FDA labs found an increasing level of noncompliance.
Table: Laboratory Sample Compliance Rates by Fiscal Year
Conclusions
OPQ faces increasingly global challenges as it seeks to protect the drug supply chain. Rest assured that 2023 will see FDA continue to direct resources away from the PHE and into other quality initiatives on an international scale.